 The Rest Here....
21 November, 2006
And then what?
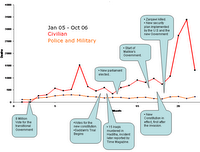
The chart below is a graphical representation of the official death toll in Iraq. It is hard to find a positive perspective given the available data, and with obvious increasing trend of violence, there won’t be any reason to be positive in the foreseeable future.
 The Rest Here....
The Rest Here....
7 comments:
NOTE: By making a post/comment on this blog you agree that you are solely responsible for its content and that you are up to date on the laws of the country you are posting from and that your post/comment abides by them.
To read the rules click here
If you would like to post content on this blog click here
I'm sorry, but the graph doesn't mention what's being plotted on either of the 2 axes, so it's a bit confusing to decipher it. Is it casualties against the months of the year?
ReplyDeleteSo why not scale it instead of cropping? That way you could keep it smaller but still show everything.
ReplyDeletea bunch of retards. why don't you spare us the "smart" ideas and actually make a comment that is related to the post.
ReplyDeleteVery interesting post, where did you get these statistics from? they are shocking numbers. Soon they will run out of Iraqi's to kill. D
"Retards"? Seems to me they just wanted stuff that we can read on this site?
ReplyDeleteWhy not call the poster a retard for saying that they cropped the picture in order to keep it small when they should have resized it instead?
And the comments are related to the post since they have to do with the picture in the post, right?
anony 1:
ReplyDeleteJust click the graph and you will get what you want. Plus, I made sure that the facts remained in the body of the post anyway, which obvisously haven't read..
anany2:
Here is my soucre:
http://www.iraqbodycount.org/
A for the retard, I dont beilieve they are ratrds, just little children waiting to grow up..
hahahaha Hesham..."just little children waiting to grow up" True.
ReplyDeleteThe post clearly shows the link to the full article.
Buggers
Much better pic!
ReplyDelete